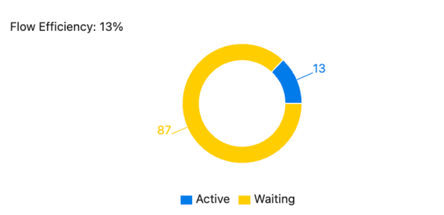
Flow Efficiency measures the proportion of time that work items spend in active progress compared to their total time in the workflow. This metric uncovers delays resulting from waiting periods and empowers teams to optimize processes and drive higher productivity.
How Flow Efficiency is Calculated
Flow Efficiency is calculated using the following formula:
Flow Efficiency (%) = (Active Time ÷ Total Time) × 100
- Active Time: The total time work items are actively being worked on.
- Total Time: The sum of Active Time and Waiting Time.
If a work item has:
- Active Time: 10 days
- Waiting Time: 5 days
Then the Total Time = Active Time + Waiting Time = 10 + 5 = 15 days
Using the formula:
Flow Efficiency (%) = (Active Time ÷ Total Time) × 100
Flow Efficiency (%) = (10 ÷ 15) × 100
Flow Efficiency (%) = 66.67%
In this scenario, 66.67% of the time was spent actively working on the item, while the remaining 33.33% was spent in waiting.
To generate the Flow Efficiency graph, @Scale uses Azure DevOps Analytics and processes data as follows:
-
Querying the Data Per Day:
- The entity type
WorkItemBoardSnapshotis queried daily to retrieve snapshots of work items across specified states. - Daily snapshots ensure an accurate breakdown of Active and Waiting states over time.
Queries are made for:
-
Selected ARTs (Agile Release Trains)
-
Teams associated with the ARTs
-
Planning Intervals (PI) Iteration Paths
-
Work item types selected in the filter settings
-
States categorized as "Active" (doing) or "Waiting" (queued) based on board column configurations in Azure DevOps.
- The entity type
-
Configuration Requirements:
- Ensure that all board columns in Azure DevOps are configured and mapped correctly.
- Missing columns will result in incomplete data in the Flow Efficiency calculation.
-
Data Selection:
- Filters applied in the @Scale analytics interface determine:
- Work item types
- Teams
- ARTs and PIs
- Only relevant iterations and states are included in the calculation.
- Filters applied in the @Scale analytics interface determine:
-
Cross-Project Support:
- Flow Efficiency supports cross-project ARTs. Ensure all involved projects and teams are configured and accessible in Azure DevOps.
The Flow Efficiency graph displays:
- Percentage breakdown of Active Time and Waiting Time per day.
- Trends over the selected time range to highlight process inefficiencies.
- Balanced Workflow: 50% Active Time and 50% Waiting Time indicate a balanced yet improvable process.
- High Waiting Time: 20% Active Time and 80% Waiting Time suggest bottlenecks or delays in the workflow.
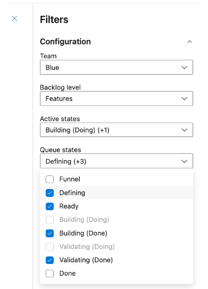
- Use the filter options in the @Scale analytics settings to customize the data displayed:
- Select ARTs, PIs, teams, and work item types.
- Adjust date ranges to focus on specific periods.
- Ensure board columns in Azure DevOps are correctly set as "Doing" or "Queued."
- Split columns (e.g., "In Progress - Doing" and "In Progress - Done") are supported and automatically categorized.
-
Identifying Bottlenecks:
- A high percentage of Waiting Time indicates potential areas where work is delayed.
- Drill down into specific states or work item types causing delays.
-
Optimizing Workflow:
- Increase Active Time by minimizing time spent in Waiting states.
- Adjust team processes or priorities to address inefficiencies.
Q: What if no data is displayed in the graph?
A: Ensure board columns are configured in Azure DevOps and mapped to "Doing" or "Queued." Missing configurations can result in incomplete data.
Q: Can I analyze data across multiple projects?
A: Yes, Flow Efficiency supports cross-project ARTs. Ensure all necessary permissions and configurations are in place.
Q: How often is data updated?
A: Data is queried and updated daily from Azure DevOps Analytics, ensuring trends reflect accurate and timely information.