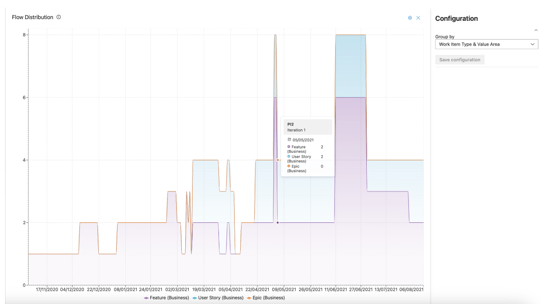
The Flow Distribution graph offers a comprehensive visualization of how work items progress through each workflow stage. By highlighting areas where tasks may accumulate, it enables teams to identify and address bottlenecks, supporting more effective planning. Leveraging this capability empowers organizations to drive productivity and streamline their development processes.
Configuration
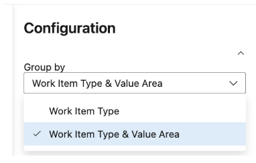
Flow distribution can be configured to separate data by Work items or Work items & Value Area. This means that if your organization uses example the work item Feature, but you separate these by Value Area, Example Architecture & Business, these can be separated to visually show this separation of work in the graph.
Retrieving the data
We query the following entries:
- Date value between selected ARTs PI Start and End Date
- Has team id in list of teams included in the selected ART
- Has an iteration that starts with the selected ARTs PI iteration paths (or team iterations if applicable)
- Has a work item type in the list of selected work item types in the filter in the @Scale analytics
Entries that share identical dates are organized into distinct groups, which are added to a property to enable dataset filtering.